
Introducing Entra Extensions Manager: A Better Way to Manage Custom Extensions

Ever felt like you needed some more options to store data in Entra, or the pain of having to figure out what, when and where data is stored? me too...

In my last blog post, I went over the different custom extensions in Microsoft Entra, their strengths and weaknesses, where they fit in, and my thoughts and recommendations on when to use each.
On top of that, I promised to show a project to help manage them, as working with custom extensions can be a pain, especially in larger or inherited environments.
This leads me to today, where I'm happy to announce the first public version of my new open-source project: Entra Extensions Manager.
Rather than just throwing a GitHub link at you and calling it an announcement, join me in taking a look at the project and it's features!
Links to the solution:
Table of Contents
What and why is Entra Extensions Manager?
Entra Extensions Manager is a browser-based portal for discovering, reviewing, and managing custom extensions across a Microsoft Entra environment.
This includes Schema extensions, Directory extensions, and Open extensions, with support for reading, creating, editing, deleting, and assigning extensions where they're supported.
The reason for building it is pretty simple.
Working as a consultant, I see a lot of different environments. Some I know quite well, while others I know almost nothing about. When coming into an unfamiliar or inherited environment, figuring out which custom extensions exist, what they're for, where they're being used, and how they're configured can quickly become an annoyance.
I've seen the same problem for developers, new hires, and others who need to work with an Entra environment they didn't build themselves, and frankly even once they DID build themselves.
To be honest, I mostly made it to make my own work easier, but I suppose that's how most projects begin 😁
The hosted portal is released as a multi-tenant application and has deliberately been built without an application backend receiving or processing your Microsoft Graph data.
The project is also completely open source and has been designed to be self-hosted if you would rather use your own Entra app registration and hosting.
We'll get back to how to run that at a later date.
Let's take a closer look at the features!
Features of Entra Extensions Manager
The main navigation in Entra Extensions Manager is split between the three types of custom extensions: Schema, Directory, and Open extensions.
Alongside those are several tools aimed at making it easier to investigate, validate, and work with extensions.
Let's go through them one at a time, starting out with the main navigational plane.
Core Management Features
These features is the core of the project, allowing for mostly frictionless management of each type of custom extension attributes
Schema extensions
The Schema extensions area gives you an overview of the Schema extension definitions registered in Entra.

By default it's filtered to In development which only shows extensions in the tenant, modifying this to Available or All Statuses expands this to all usable Schema extensions across the whole of Entra ID, not limited by tenant.

From here, you can inspect the definitions and their properties, including information such as their status, target object types, properties, and ownership.
When switching the portal into Edit mode, you can also perform any supported management action.
This includes creating Schema extension definitions, editing them where allowed, moving them through their supported lifecycle states, or modifying their properties.

One of the things the portal tries to make clear is that Schema extensions have some fairly important lifecycle restrictions.
As a reminder from my last post, a Schema extension has the lifecycle of:
InDevelopment → Available → Deprecated
But it can't move backwards.
Once an extension becomes Available, its properties and target types are locked, leaving only its description editable.
I try to put a spotlight on these limitations through Entra Extensions Manager before you make a change that can't easily be modified.

Directory extensions
Directory extensions also have their own dedicated area.

In this section, Directory extensions are shown in the context of the app registrations that owns them. Each of the extensions are shown with information such as its fully qualified name, data type, supported target object types, and source.
In Edit mode, new Directory extension definitions can be created for supported target object types, and existing definitions can be deleted where Microsoft Graph allows it.

There is an important difference from Schema extensions here:
Microsoft Graph doesn't support updating Directory extension definitions, and therefore changing a definition will require deleting and recreating it, which can have consequences for extension attributes with existing values.
Again, that's the kind of behavior I want the portal to make visible rather than hide behind a friendly-looking Edit button.
Open extensions
These extensions work quite differently from Schema and Directory extensions.
Open extensions aren't registered as tenant-wide definitions. Instead, they're stored directly on individual objects.
Therefore the Open extensions area is object-based rather than definition-based, meaning it's empty before selecting an object:

You can select Users, Groups, Devices, or the Organization object and inspect the Open extensions stored on them.
For Users, Groups, and Devices, the portal includes an autocomplete directory search to help quickly finding what is looked for, while the Organization is fixed.
Once an object is selected, its Open extensions and stored data can be inspected.

In Edit mode, Open extensions can also be created, edited, and deleted.

Unfortunately my solution is limited by Microsoft Graph, which doesn't provide an endpoint for enumerating every Open extension across an entire tenant, which is why we need to go object by object.
Though once again, Entra Extensions Manager can't change how Graph works, but hopefully it'll make working within the limitations less painful.
Expansion Tools
These tools are an expansion to what's currently available natively. These tools help with different things from monitoring to validations and auditing.
Usage monitor
While the management sections are great for managing and knowing which extension definitions exists are incredible useful, it's not the full picture.
Especially when I'm investigating an unfamiliar environment, there's another question I want answered rather quickly:
Is anything actually using any of these custom extensions?
That's what the Usage monitor is for.

This tool provides a dashboard with an overview of stats, and info on each extension.
This gives you a way to go beyond the definition itself and start investigating whether data is actually being stored using it.
An extension can then be further expanded to drill into the objects holding values, including showing the actual data stored:

Results are loaded in pages and can also be exported to CSV or JSON for further investigation.
One case I particularly wanted to surface is deprecated extensions that still contain values, as extensions being deprecated doesn't mean the data associated with it disappears.
If the Usage monitor discovers values for a deprecated definition, the portal flags it so you can investigate whether a migration or cleanup is required before doing anything destructive.
Think of the Usage monitor as an investigation and monitoring tool.
Validate value
The next tool is Validate value.

This lets you test proposed extension values against the extension definition and target object behavior. Note that it does actually write to the object for the extension, then automatically cleans up with a null PATCH.
The idea is to catch problems before that value ends up being used by your application, PowerShell script, automation, or whatever else is writing to Microsoft Graph.
It's a fairly small tool, but useful when you're building or troubleshooting something that depends on custom extension data.
Manifest snippet
You might not want to perform actions through Entra Extensions Manager, which is completely fine - I still want to help lessen the administrative burden, which lead to this next tool.

The Manifest snippet tool generates ready-to-use examples for working with an extension outside the portal.

Depending on the extension, the examples include:
A Graph JSON body
A Graph PowerShell command
An app registration manifest shape for Directory extensions
A raw HTTP request
If my project can help you discover the right extension and then give you what you need to use and manage in whatever way you need, that's just as useful as being a direct management portal.
Audit log
The final tool is the Audit log.
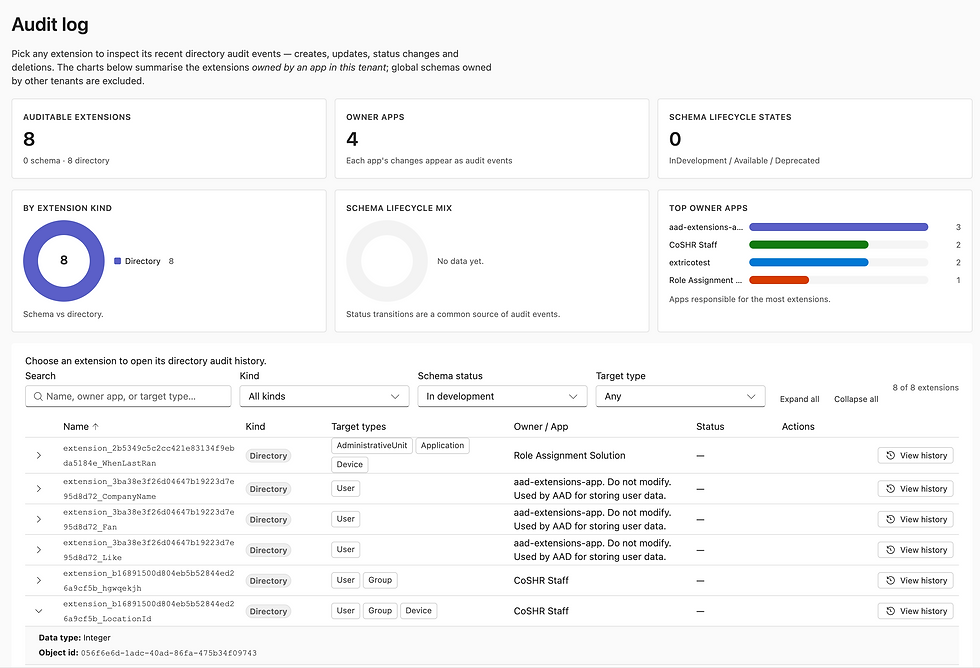

This helps find extension-related directory audit events when you need to investigate changes made in the environment.
Rather than manually digging through the wider directory audit log, it gives you a more focused place to start when you're trying to figure out what happened to an extension, both in terms of actions to an extension as well as actions using an extension.
Quality of life features
These features are the things that makes the portal a bit more useful or fun while not strictly being required, or even having anything to do with managing extensions.
Some of these are useful, others are just because I found it fun.
Working across multiple tenants
Arguably the most useful QoL feature, is this one, which I find particularly useful for my own work: the Tenant switcher.

When you're a member of multiple Entra tenants, the portal can retrieve those tenant memberships and let you switch between them from within Entra Extensions Manager.
It's not necessarily the most exciting feature if you only ever work in a single environment, but if you're constantly jumping between customer tenants, it's one I appreciate quite a bit.
Commands, Shortcuts & a bit of fun
Entra Extensions Manager includes multiple smaller QoL features, such as a command palette, keyboard shortcuts, multiple skins and a guided tour.
Using the shortcut Ctrl/⌘ + K opens the command palette, which can be used to jump between pages, switch modes and themes, start tours etc.

There are also keyboard shortcuts for things such as focusing search, creating something new, and switching Edit mode.

To help with navigating the portal, Guided tours are available from the Help button if you're not sure what a particular page or control does.

And then of course there are the skins.
Were these necessary in anyway or form? Obviously not.
Did I spent time on it anyway? Absolutely!
There are currently five to choose from:
Fluent (default)
Retro
8-bit
Synthwave
Newsprint
Each comes with light and dark variants.
Your UI preferences are stored locally in the browser, so the portal remembers your chosen skin and theme.
Which of the skins are your favorite?
I especially like the Newsprint skin

What happens to my tenant data?
There is one very important topic I haven't talked about yet.
Entra Extensions Manager is asking you to authenticate with Microsoft Entra and, depending on what you're doing, grant it some fairly significant delegated Microsoft Graph permissions.
So it makes sense to ask:
What happens to the data it can access?
Entra Extensions Manager has deliberately been designed as a browser-only application.
This also means Microsoft Entra authentication and Microsoft Graph data access happen directly from your browser, with no storing of any of your data.
There is no application-owned runtime service receiving, proxying, storing, or processing your tenant data.
There is also:
No database used for portal data
No storage account used for portal data
No server-side cache containing Graph data
No telemetry endpoint receiving tenant data
No persistence of Microsoft Graph data by the portal
Graph results are held as transient browser state for as long as they're needed to render the current experience.
Authentication state and access tokens are held in browser sessionStorage, while basic UI preferences such as your chosen theme is stored in the localStorage.
Most importantly, Microsoft Graph requests always use delegated permissions.
The signed-in user remains the security principal for Graph operations, and Entra Extensions Manager can't bypass the user's Entra roles, Graph authorization, Conditional Access policies, or other tenant controls.
Ofcourse there is also the option to self host the portal, to move complete control into your own hands.
Read and Edit mode
By now I've mentioned Edit mode a few times, and you've probably also have noticed the Read and Edit buttons in the header throughout the screenshots.
The portal starts in Read mode using read-oriented Microsoft Graph permissions, with switching to edit mode always prompts for re-authentication.
The elevated permissions required to write anything to Microsoft Entra is requested when you switch into Edit mode.
This allows you to use the portal for investigation without write permissions until the moment you actually need them, aligning with the Least Privileged zero trust principal.
There's quite a bit more detail behind the authentication model, exact Graph permissions, suggested Entra roles, security boundaries, and data handling, though rather than reproducing all of that here, I've documented it in the GitHub repository for anyone who wants to dig into the details.
Don't trust my hosted version? Self-host it
The hosted multi-tenant portal is intended to be the easiest way to use Entra Extensions Manager.
But as mentioned, it's not the only way.
The project is open source and has been built so that it can also be hosted as a static web application using your own Microsoft Entra app registration and Azure environment.
While self-hosting puts the full control into your hands, you'll still get the same full portal solution including the full browser-based, no backend, no database model of the hosted version.
Microsoft Graph requests are still made directly from the browser using delegated permissions.
Each GitHub release includes a downloadable package that can be configured with your own app registration and deployed to as a static webapp.
You could even build it yourself as the full code is available on my GitHub
I'll cover the complete self-hosting process separately, but the repository already contains the configuration and deployment instructions if you want to get started now.
Guided Demo Mode - Test without your data
As with any project, getting anyone to login with their own data to test it, requires a lot of trust and goodwill. To allow anyone to give it a go, with or without the trust, Entra Extensions Manager includes a Demo mode that lets you explore the portal without signing in.

The demo is backed by a completely simulated tenant containing sample Schema, Directory, and Open extensions along with usage and audit data.
Nothing is sent to Microsoft Graph.
Write operations are simulated as well, meaning you can create, assign, edit, and delete things and see how the portal behaves without touching a real environment.
Everything happens in memory for that browser session.
The demo also includes the guided tours, making it probably the easiest way to get a feel for what Entra Extensions Manager does before deciding whether you want to connect it to a real tenant or 10.
Entra Extensions Manager Links
The entire project is available on GitHub, including the source code, releases, self-hosting instructions, permission requirements, security model, and documentation around some of the Microsoft Graph behaviors you should be aware of.
It also includes a rather comprehensive README with lots more information than I put in here: Entra Extensions Manager GitHub
If you want to get right to it, you can access the portal directly from the Tools menu on my website, or on this link: Entra Extensions Manager
Wrapping up the announcement
There we have it.
The first public version of Entra Extensions Manager, and what a ride huh?
What started as a way to make working with custom extensions a little easier for myself has turned into a considerably larger project than I originally expected, which hopefully fills a gap that others in the community have run into, as much as I have.
Now with all that chatter done, let's take a short break for the mandatory bad joke!
Why did the developer go broke?
Because he used up all his cache 😎
The goal have always been pretty clear; Lessen the pain of using these very strong features in Microsoft Entra.
I want to make it easier to discover what's in an environment, understand what you're looking at, investigate how extensions are being used, and perform the operations Graph supports without needing to write another one-off script every time.
This is the first public release, so I'm sure there are still edge cases, stuff I missed, glitches and bugs hiding somewhere waiting for somebody to find them.
The project is open source, and feedback, issues, ideas, and contributions are, as always, very welcome!
Give the demo a try, have a look through the source, or connect it to your own data.
And if you find something weird, please tell me or make a PR fixing it 😉


Comments